데이터/데이터 분석
[데이터시각화/Plotly] Colopleth로 지도에 정보 시각화하기
성장하기
2023. 9. 30. 21:04
Geojson으로 좌표값 불러온 후 geopandas 객체로 선언하기
미국 geojson 다운 받기
from urllib import request

url = '<https://github.com/PublicaMundi/MappingAPI/blob/master/data/geojson/us-states.json>'
savename = './data/us-states.json'
request.urlretrieve(url,savename)
print("저장되었습니다.")
https://github.com/PublicaMundi/MappingAPI/blob/master/data/geojson/us-states.json
json 불러와서 geo 파일 저장
import json

with open('./data/us-states.json', 'r') as f:

    json_data = json.load(f)

geo = json.dumps(json_data, indent="\\t")
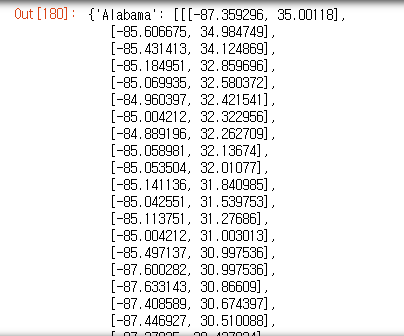
json dict 선언
geo_dict = eval(geo) # eval 함수로 dictionary형태 그대로 선언해버린다.

state_geo_dict = {}

for idx in range(len(geo_dict['features'])): # json 파일 내부를 들여다 본후 주 이름 : 좌표 형태로 넣어주기
    tmp_key = geo_dict['features'][idx].get('properties').get('name')
    tmp_value = geo_dict['features'][idx].get('geometry').get('coordinates')
    state_geo_dict.setdefault(tmp_key, tmp_value)

state_geo_dict
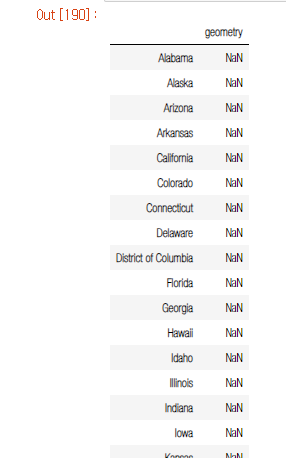
데이터 프레임으로 선언한 후 값을 넣어준다.
geo_df = pd.DataFrame(index=state_geo_dict.keys(), columns = ['geometry'])
geo_df
for key, value in state_geo_dict.items():
    geo_df.loc[key, 'geometry'] = value
[’Alaska’, ‘Hawaii’]등은 geometry 정보가 4차원으로 되어있다.
4차원 배열 (4d array to geometry)을 geomtry로 만들기 애먹었었는데, shapely에 있는 unary_union 메서드를 사용하면 쉽게 변환이 가능하다.
따라서, shapely의 메서드들을 이용해 3차원으로 쪼개 MultiPolygon으로 만든 뒤 다시 unary_union으로 합쳐준다.
import geopandas as gpd
from shapely.geometry import MultiPolygon, Polygon
from shapely.ops import unary_union

# 3d_array를 Multypolygon으로 변환
def to_polygon(coordinate):
    polygons = [Polygon(coords) for coords in coordinate]
    multi = MultiPolygon(polygons)
    return multi

# 4차원 array를 geometry로 변환
def to_geo_4darray(array):
    multi = []

    for array_3d in tmp_geo:
        polygons = [Polygon(coord) for coord in array_3d]
        multi.append(MultiPolygon(polygons))

    return unary_union(multi) # 각각의 MultiPolygon을 하나로 합쳐줌

for idx in geo_df.index:
    coordinates = geo_df.loc[idx, 'geometry']
    if idx not in ['Alaska', 'Hawaii', 'Maryland', 'Michigan', 'Rhode Island', 'Virginia', 'Washington']:
        geo_df.loc[idx, 'geometry'] = to_polygon(coordinates)
    else:
        geo_df.loc[idx, 'geometry'] = to_geo_4darray(coordinates)
geopandas 의 DataFrame 객체로 선언해준다.
import geopandas as gpd
geo_df = gpd.GeoDataFrame(geo_df, geometry='geometry')
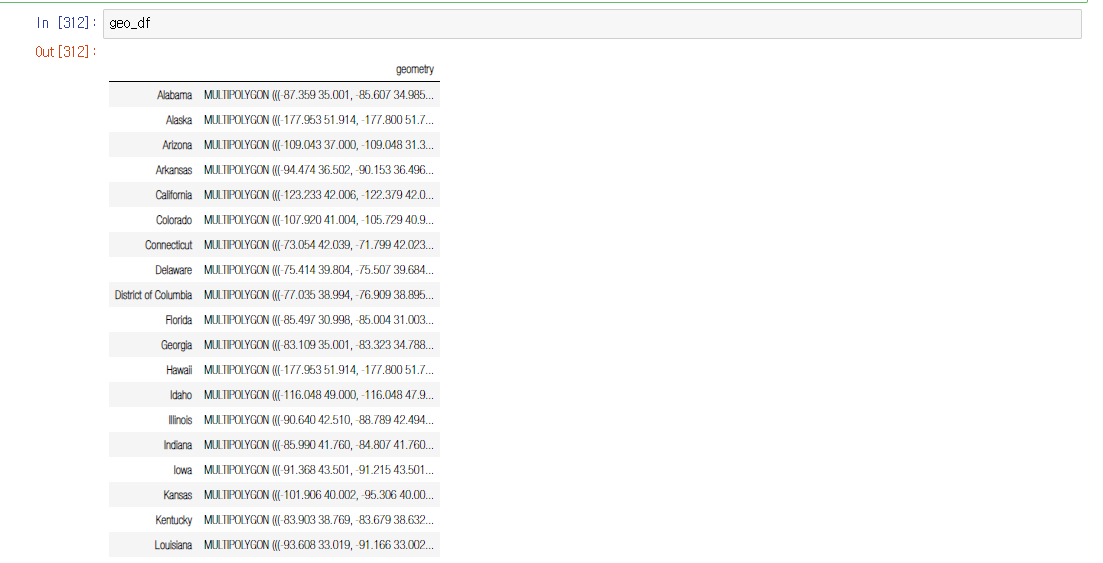
- MultiPolygon으로 정상적으로 입력되었다.
geopandas의 구조는 다음과 같다
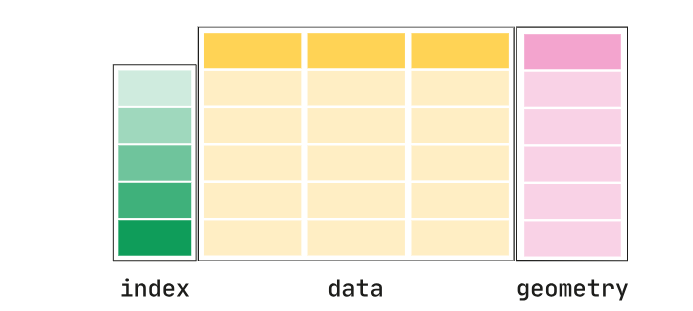
geopandas.GeoDataFrame은 pandas.DataFrame의 subclass로서, geometry를 다를 수 있다. 일반적인 데이터와 geopandas.GeoSeries가 합쳐진 형태로, geometry와 함께 다른 데이터들을 담으면 된다.
따라서 방금 넣은 geometry컬럼을 geometry로 지정한 후, 다른 data를 넣어 시각화 해주면 된다.
- 이제 geometry DataFrame을 만들었으니, 시각화 해보겠다.
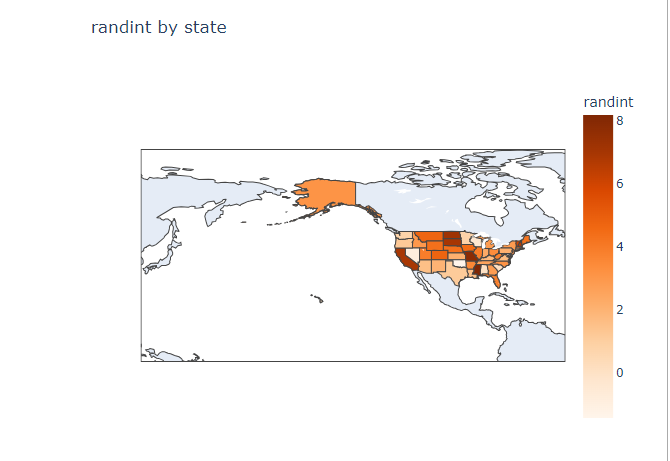
Plotly를 이용한 시각화
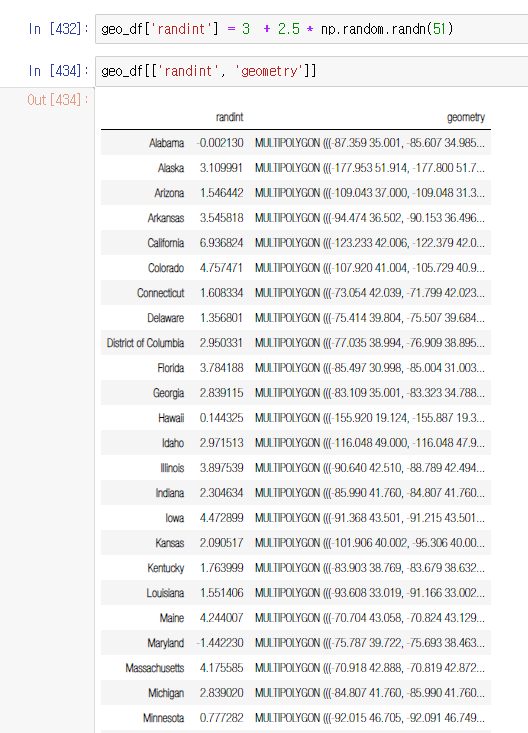
- geo_df에 시각화 하고자 하는 값을 추가한다.
geo_df['randint'] = 3  + 2.5 * np.random.randn(51) # 평균 3, 분산 2.5인 정규분포로 샘플값 넣었다.
# 시각화하고자 하는 값을 추가하여 넣으면 된다.
import plotly.io as pio

fig = px.choropleth(geo_df['randint'], locations=geo_df.index, geojson=geo_df['geometry'], color='randint', # color 인자로 색을 구분하고자 하는 인자를 넣어준다.
                   color_continuous_scale='Oranges',
                   hover_name=geo_df.index, hover_data='randint', title='randint by state')
fig.update_geos(fitbounds="locations", visible=True) # 요걸 해줘야 원하는 지점 지도를 그릴 수 있다.
#  pio.write_html(fig, file='score_by_state_choropleth.html', auto_open=True)
 # 필요시 html로 저장
fig.show()